How to Report SEM Fit Indices: CFI, RMSEA, SRMR

Andrzej Szymkowiak · Last reviewed July 2026
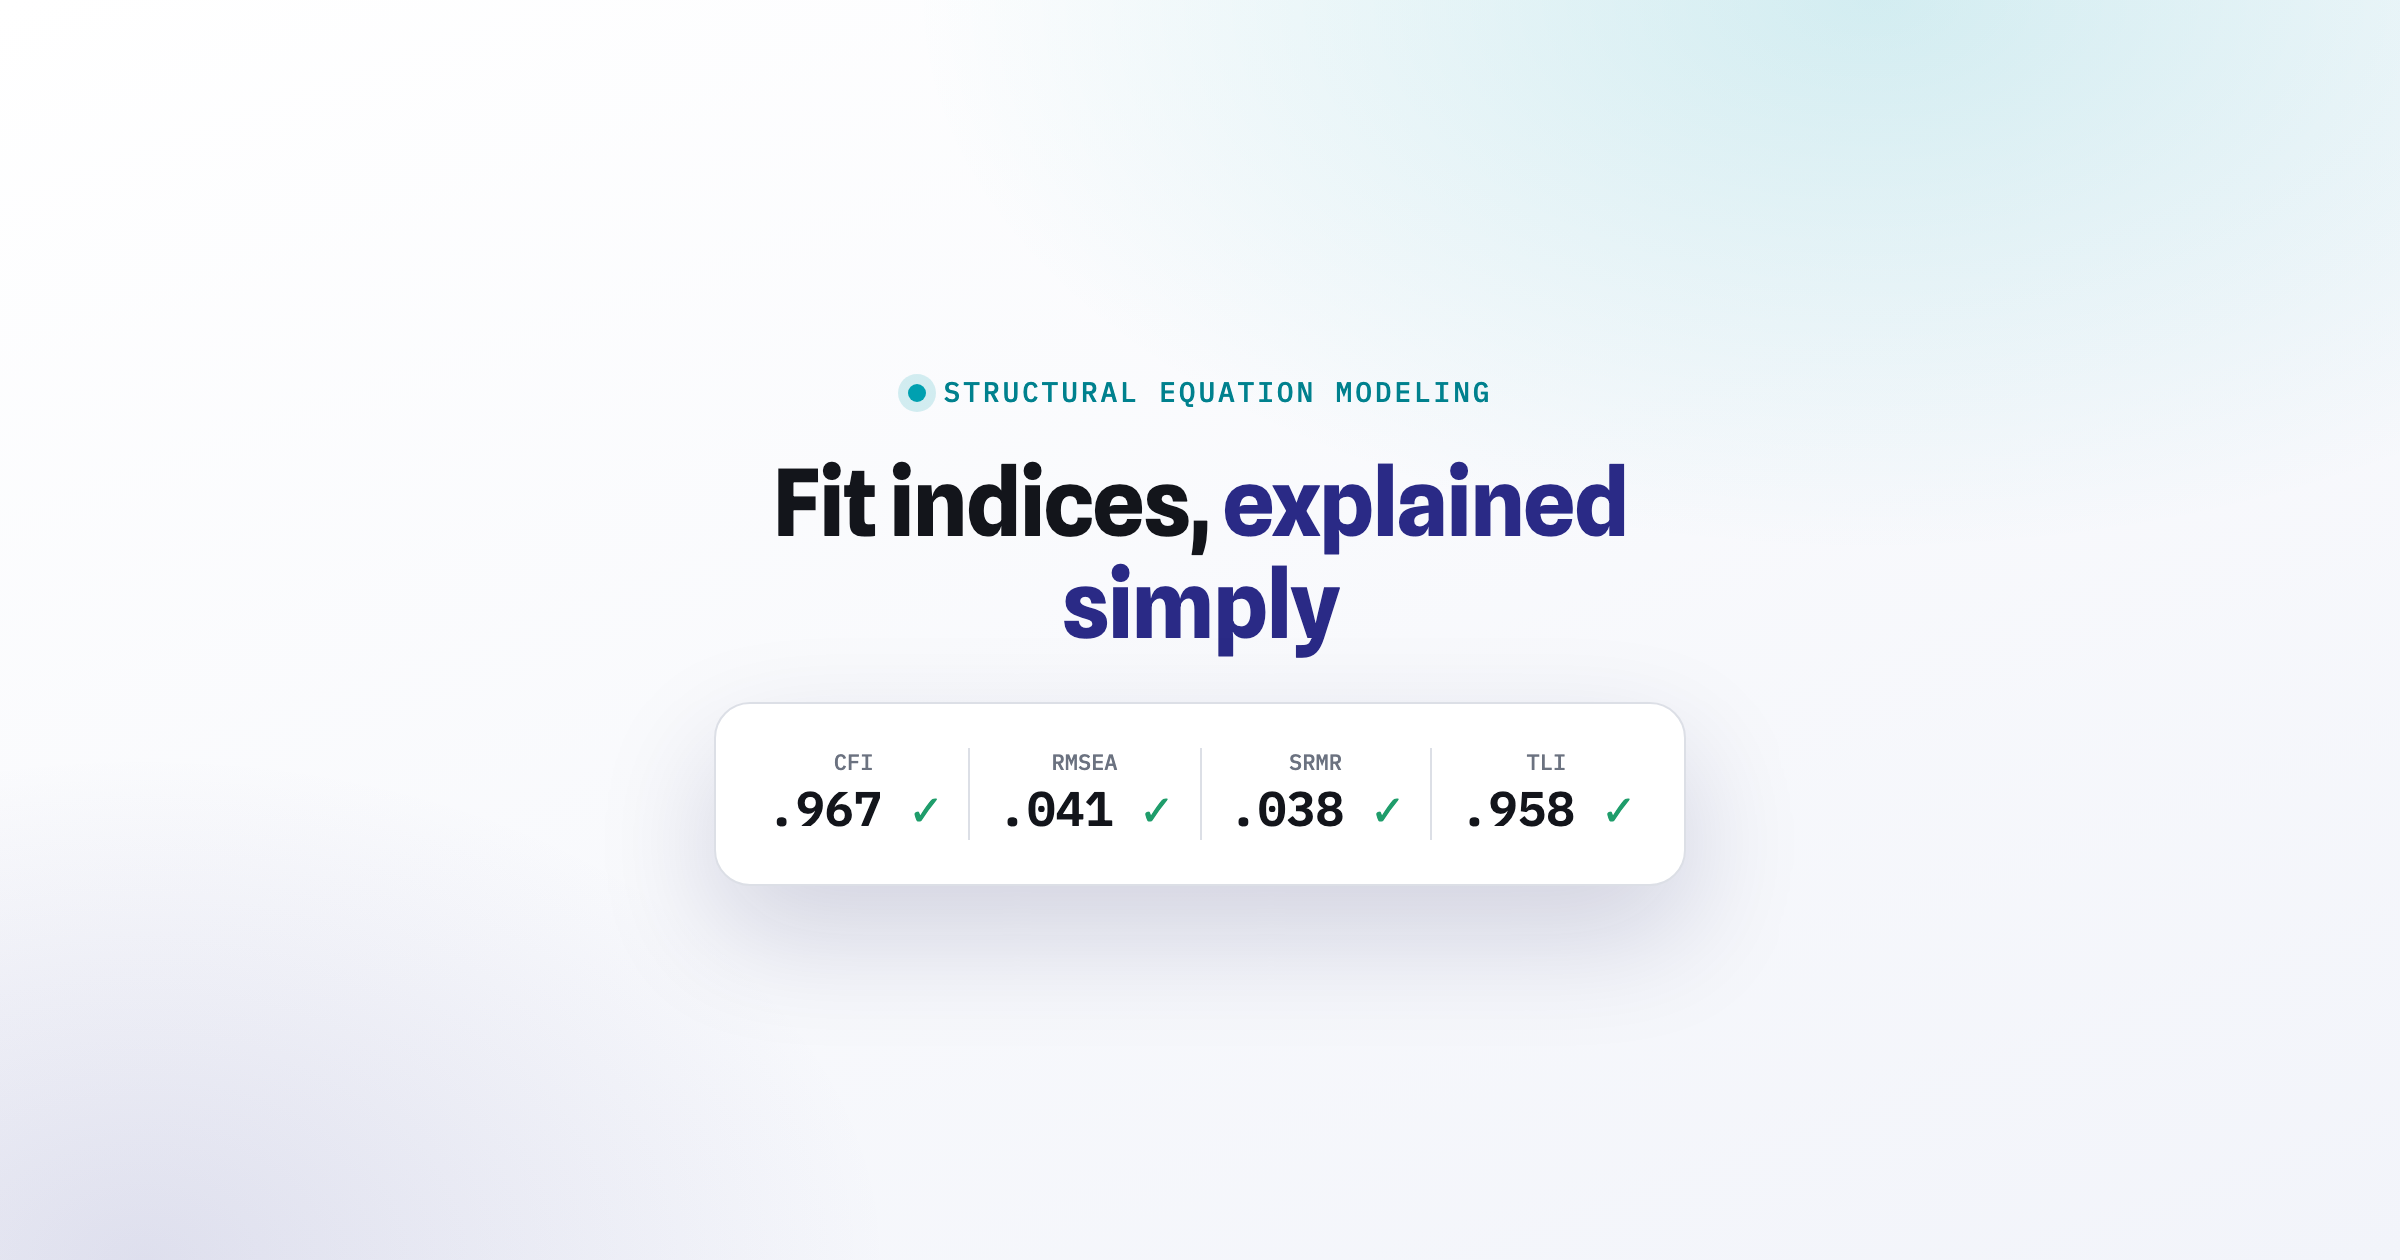
TL;DR: To report SEM or CFA model fit in APA style, give one compact set of numbers: χ² with its degrees of freedom and p value, CFI, TLI, RMSEA with its 90% confidence interval, and SRMR. APA style does not prescribe a fixed list; this is the set most commonly reported and the one most reviewers expect. The sentence pattern is: χ²(98) = 142.31, p = .002, CFI = .97, TLI = .96, RMSEA = .038, 90% CI [.023, .051], SRMR = .041. Use no leading zero for indices that cannot exceed 1 (write .97, not 0.97), and report χ² for completeness rather than judging fit on it alone.
A reviewer just asked you to justify your model fit. This guide covers the reporting step: which numbers belong in the sentence and in the fit table, in what order, and in what format. Some journals also ask for the χ²/df ratio, so add it when the outlet expects it. The cutoff values themselves live in the threshold pages (all fit cutoffs at a glance collects the whole set, and the χ²/df ratio covers that one), and they are repeated below only as a quick reference while you write. The rest of the guide gives the APA formatting rules, a worked example you can copy, and the wording to use when the fit is not good.
Why you report several indices
Model fit is not one number. Each index looks at fit from a slightly different angle, so you report a small set together. Reporting only one index — especially the chi-square test — is not enough. A common, well-cited set is: χ², CFI, TLI, RMSEA, and SRMR (Hu & Bentler, 1999).
The chi-square test (and its problem)
The χ² test evaluates the null hypothesis that the covariance matrix implied by your model equals the population covariance matrix. A non-significant χ² is consistent with good fit, but it does not prove the model: failing to reject the null is not the same as confirming it. The problem: χ² is very sensitive to sample size. With a large sample, χ² is almost always significant, even for a good model. So you report it for completeness, but you do not reject a model on χ² alone. Report the value, the degrees of freedom, and the p value:
χ²(98) = 142.31, p = .002
The incremental indices: CFI and TLI
CFI (comparative fit index) and TLI (Tucker-Lewis index) compare your model with a baseline model in which all variables are unrelated. Higher is better. CFI is bounded between 0 and 1, while TLI is not normed — it can occasionally exceed 1 or fall below 0.
- CFI ≥ .95 = good fit; ≥ .90 = acceptable fit.
- TLI ≥ .95 = good fit; ≥ .90 = acceptable fit.
The absolute indices: RMSEA and SRMR
RMSEA (root mean square error of approximation) and SRMR (standardized root mean square residual) measure how far your model is from a perfect fit. Lower is better.
- RMSEA ≤ .06 = good fit; ≤ .08 = acceptable fit. Always report the 90% confidence interval for RMSEA.
- SRMR ≤ .08 = good fit.
The cutoffs in one table
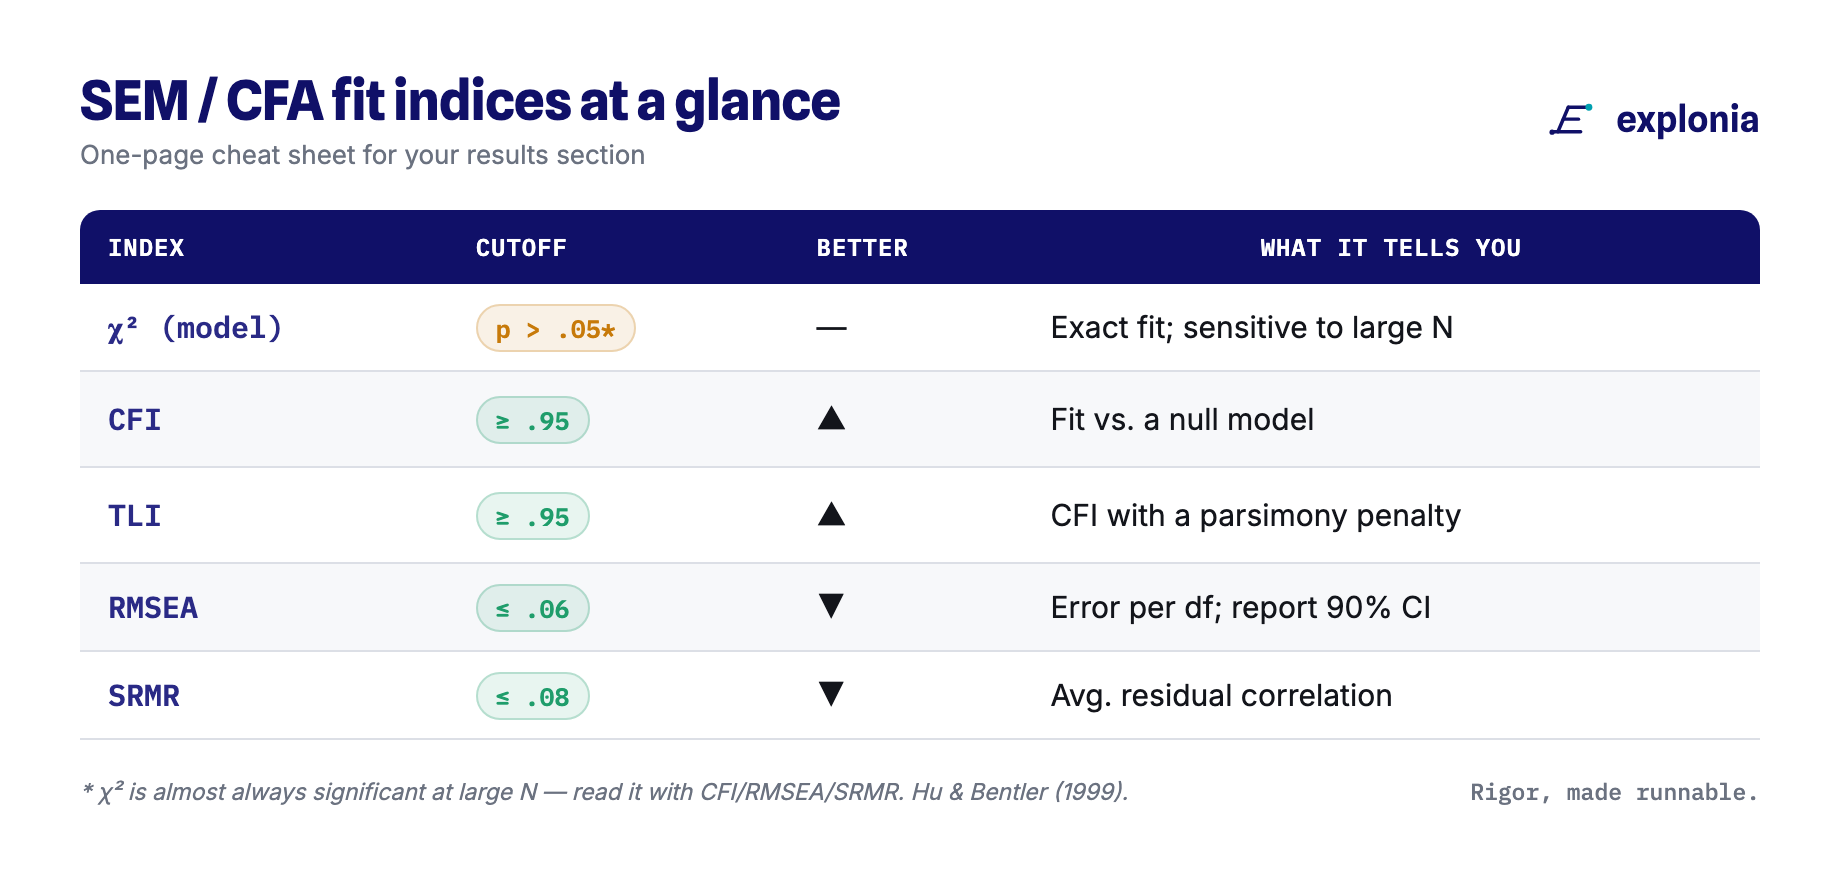
| Index | Good fit | Acceptable fit | Notes |
|---|---|---|---|
| χ² | non-significant | — | sensitive to large N; report but do not over-rely |
| CFI | ≥ .95 | ≥ .90 | higher is better |
| TLI | ≥ .95 | ≥ .90 | higher is better |
| RMSEA | ≤ .06 | ≤ .08 | report 90% CI |
| SRMR | ≤ .08 | — | lower is better |
Split the attribution: the stricter "good fit" cutoffs come from Hu and Bentler (1999), while the "acceptable" .90 convention traces to an earlier paper — Bentler and Bonett (1980) proposed it for NFI and TLI (then called NNFI), and it was later carried over to CFI (Bentler, 1990) — and RMSEA ≤ .08 reflects a separate earlier convention (Browne & Cudeck, 1993). Treat them as guidelines, not hard pass/fail lines. Hu and Bentler (1999) also recommend a joint criterion rather than reading any single index alone — for example, SRMR ≤ .08 together with CFI ≥ .95. Judge fit across the whole set of indices, and consider your sample size and model complexity (if you are still at the design stage, see sample size before data collection for guidance on choosing an adequate N). The cutoffs were derived under specific simulation conditions, so do not over-generalize them: they can behave differently with small samples, complex models, or different estimators, and a model that just misses one value is not automatically "wrong" (Marsh, Hau, & Wen, 2004).
Formatting rules in APA
- Report χ² with its degrees of freedom in parentheses and the p value: χ²(df) = value, p = …
- Use no leading zero for indices that cannot exceed 1: CFI = .97 (not 0.97). The same goes for TLI, RMSEA, SRMR.
- Give the RMSEA confidence interval in square brackets: RMSEA = .038, 90% CI [.023, .051].
- Italicize statistical symbols where APA expects it (for example p).
A worked example
You run a structural model with N = 320. The output gives χ²(98) = 142.31, p = .002, CFI = .97, TLI = .96, RMSEA = .038 with a 90% CI of [.023, .051], and SRMR = .041. Check each against the table: CFI and TLI are above .95, RMSEA is below .06, and SRMR is below .08. All indices point to good fit, even though χ² is significant — which is expected at this sample size. Your APA sentence:
The structural model showed good fit to the data, χ²(98) = 142.31, p = .002, CFI = .97, TLI = .96, RMSEA = .038, 90% CI [.023, .051], SRMR = .041.
CFA fit before SEM fit
It is good practice to confirm the measurement model before you trust the structural model. In a two-step approach, you first run a CFA to check that your items load on the right factors and that fit is good, then you add the structural paths and run the SEM. If the CFA fit is poor, the structural results sit on a shaky base, so fix the measurement model first. Report both: the CFA fit shows your constructs are measured well, and the SEM fit shows the path model holds. The same indices and cutoffs apply to both steps, which is why a single fit table format works throughout. For the full measurement-side write-up, see how to report CFA results in APA, and check construct distinctness with HTMT vs Fornell-Larcker (Henseler, Ringle, & Sarstedt, 2015). If you run your models in R, see how Explonia compares with lavaan for a comparison of the workflow and output format.
Common mistakes to avoid
- Reporting only χ² and rejecting a good model because χ² is significant at a large N.
- Reading one index in isolation instead of Hu and Bentler's joint criterion (e.g., SRMR ≤ .08 AND CFI ≥ .95).
- Leaving out the RMSEA 90% confidence interval.
- Adding a leading zero to fit indices (write .97, not 0.97).
- Mixing robust (MLR) and non-robust indices in the same table.
A note on robust estimation
If your data are not normally distributed and you used robust maximum likelihood (MLR), report the scaled (robust) fit indices and the scaled χ². Do not mix robust and non-robust numbers in the same table. State which estimator you used so the reader can interpret the values correctly.
What if the fit is not good?
If several indices miss the cutoffs, do not just delete items until the numbers look better. Check for theory-based reasons: a misspecified path, items that load on the wrong factor, or a construct that needs two dimensions instead of one. Modification indices can suggest changes, but only apply them when they make theoretical sense, and report any change you make.
Frequently asked questions
What is a good RMSEA value?
RMSEA ≤ .06 indicates good fit (Hu & Bentler, 1999); the ≤ .08 "acceptable" line comes from an earlier convention (Browne & Cudeck, 1993). Always report the 90% confidence interval, because a point estimate alone can hide uncertainty — a wide interval that reaches above .08 is weaker than a tight one that stays below .06.
Why is my chi-square significant?
χ² is very sensitive to sample size. With a large N, even a well-fitting model usually produces a significant χ². That is why you report χ² for completeness but judge fit on the full set of indices (CFI, TLI, RMSEA, SRMR), not on χ² alone.
Which fit indices should I report?
Report χ² with its degrees of freedom and p value, plus CFI, TLI, RMSEA (with its 90% confidence interval), and SRMR. This set covers incremental and absolute fit and is what most reviewers expect (Hu & Bentler, 1999).
Do I report different indices for CFA and SEM?
No. The same indices and cutoffs apply to both. Confirm the CFA (measurement model) fit first, then report the SEM (structural model) fit using the same table format.
Can Explonia produce my fit table?
Yes. Explonia returns χ², CFI, TLI, RMSEA with its 90% confidence interval, and SRMR in one table, and drafts an APA fit sentence with your numbers, which you then edit.
References
Bentler, P. M. (1990). Comparative fit indexes in structural models. Psychological Bulletin, 107(2), 238–246. https://doi.org/10.1037/0033-2909.107.2.238
Bentler, P. M., & Bonett, D. G. (1980). Significance tests and goodness of fit in the analysis of covariance structures. Psychological Bulletin, 88(3), 588–606. https://doi.org/10.1037/0033-2909.88.3.588
Browne, M. W., & Cudeck, R. (1993). Alternative ways of assessing model fit. In K. A. Bollen & J. S. Long (Eds.), Testing structural equation models (pp. 136–162). Sage.
Henseler, J., Ringle, C. M., & Sarstedt, M. (2015). A new criterion for assessing discriminant validity in variance-based structural equation modeling. Journal of the Academy of Marketing Science, 43(1), 115–135. https://doi.org/10.1007/s11747-014-0403-8
Hu, L., & Bentler, P. M. (1999). Cutoff criteria for fit indexes in covariance structure analysis: Conventional criteria versus new alternatives. Structural Equation Modeling, 6(1), 1–55. https://doi.org/10.1080/10705519909540118
Marsh, H. W., Hau, K.-T., & Wen, Z. (2004). In search of golden rules: Comment on hypothesis-testing approaches to setting cutoff values for fit indexes and dangers in overgeneralizing Hu and Bentler's (1999) findings. Structural Equation Modeling, 11(3), 320–341.
How Explonia does this for you
Explonia runs your CFA or SEM in the browser and returns χ², CFI, TLI, RMSEA (with its 90% confidence interval), and SRMR in one fit table, using the cutoffs above. If you used robust estimation, it shows the scaled indices. To check a set of fit indices against these cutoffs without an account, use the free fit index checker. The "Article description" feature drafts an APA fit sentence with your numbers already in place, which you edit and keep as your own work. You can export the fit table to Word, R, SPSS/.sav, or LaTeX.
Want your fit table and sentence ready to edit? Run your model in Explonia and get fit reporting that follows APA style. Start free →
How to cite this article
If this article helped your research, you can cite it (APA 7):
Szymkowiak, A. (2026). How to Report SEM Fit Indices: CFI, RMSEA, SRMR. Explonia. https://explonia.com/blog/reporting-sem-fit-indices/
Last updated: July 2026
Run your whole study in one place
Design it, collect it, and run real CFA and SEM on your own data — with a draft APA paragraph you can edit. Free to start.
Start free